

Running a small business today means more than just selling a product or service; it means understanding how people find and interact with your website. That’s where Google Analytics comes in.
This free tool gives you the insights you need to improve your site performance, attract more visitors, and make better marketing decisions. In this guide, we’ll explain what Google Analytics is, how it works, and how to get started with analytics tracking on your website.
What Is Google Analytics?
Google Analytics is a free platform that collects and analyses information about how visitors use your website. Once you install a small piece of tracking code on your site, Google begins recording valuable analytics data, such as:
- Where the traffic to your website is coming from, this might be search engines, or social media, for example.
- Which pages do people view most often.
- How much time people spend on your website.
- The actions are people taking on your website, such as clicks, downloads, purchases or form submissions.
By looking at this data, you can better understand user behaviour and identify ways to improve your website and marketing efforts.
How Does Google Analytics Work?
When someone visits your website, the tracking code returns anonymous information to your analytics account. This information is grouped into a “property”. Essentially, the digital home for your website’s user data is inside Google Analytics.
From there, you can view detailed reports showing:
- The number of active users on your site at any given time.
- Which content is performing well?
- How users arrive at your site.
- Which click paths do users follow before leaving or converting?
Think of it as a dashboard that helps you see what’s working and what isn’t.
What kind of data is sent to Google Analytics?
Google Analytics collects a wide range of data that falls into 3 main categories:
- Event data: These are clicks, scrolls, form submissions, and purchases.
- Metrics: These are things that can be counted or averaged, such as the total number of sessions or the average engagement time.
- Dimensions: These are descriptive attributes of users, such as location, age, gender, or device type.
The structure of a Google Analytics Account
Before proceeding, it’s important to understand the structure of your Google Analytics account. Here is an overview:
- Account: The top level. Think of it as the container for your business or organisation. You can have multiple accounts if needed (for example, one for each business you run).
- Property: Each account can contain one or more properties. A property usually represents a website, app, or digital platform you want to track. A property has its own unique tracking ID, settings (timezone, currency, data retention), and reports.
- Data Streams: Within a property, you set up data streams (Website, iOS app, Android app). Each stream is a source of data flowing into the property.
In this guide, we’ll walk you through creating an Account, Property and Data Stream.
Setting Up Google Analytics
There are a few different ways to set up Google Analytics on your website.
Setting up Google Analytics on a WordPress website
If you have a WordPress website, setting up Google Analytics is quite easy. You can install the Site Kit by Google plugin, and then follow the prompts the plugin provides to create a Google Analytics property for your website and complete the installation of Google Analytics on your site.
Once everything is set up, you can log in to Google Analytics and analyse user behaviour.
Manually installing Google Analytics
In some cases, you may need to install Google Analytics manually. Here are the steps you need to take:
1) Create your Analytics account and GA4 property
Start by signing into Google Analytics.
If you’ve never set up a Google Analytics account before, Google will take you directly to the beginning of the process. If not, you can create a new account by navigating to the Admin section of Google Analytics, then clicking Create > Account.

Once you’ve reached the Account Creation step, you’ll simply need to input your Account name. To keep things simple, you can input your business name here.

Once you’ve input your business name, you can leave all the Account Data Sharing Settings as they are, and then click Next at the bottom of the page.
2) Creating a Google Analytics Property

On the next step, you will need to input the name of your Google Analytics property, as well as your timezone and currency.
- Property Name: Enter a name that clearly identifies the website or app you’re tracking (for example, “My Business Website”).
- Timezone: Choose the timezone that matches your business location. This ensures that reports such as daily traffic, sales, and user activity align with your local working hours.
- Currency: Select your local currency (for example, Australian dollars) so that revenue and transaction data are displayed correctly.
Once complete, click “Next” to go to the next step.
3) Describe what your business does
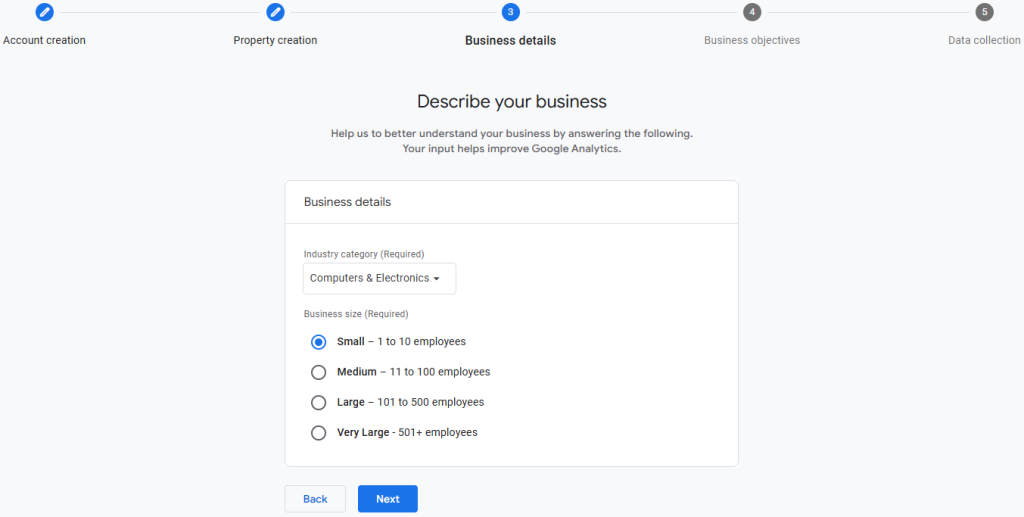
On this step of the process, you need to specify your industry, as well as the size of your business.
Your industry may not be listed, in which case you can choose “Other” from the drop-down menu.
4) Specifying your business objectives
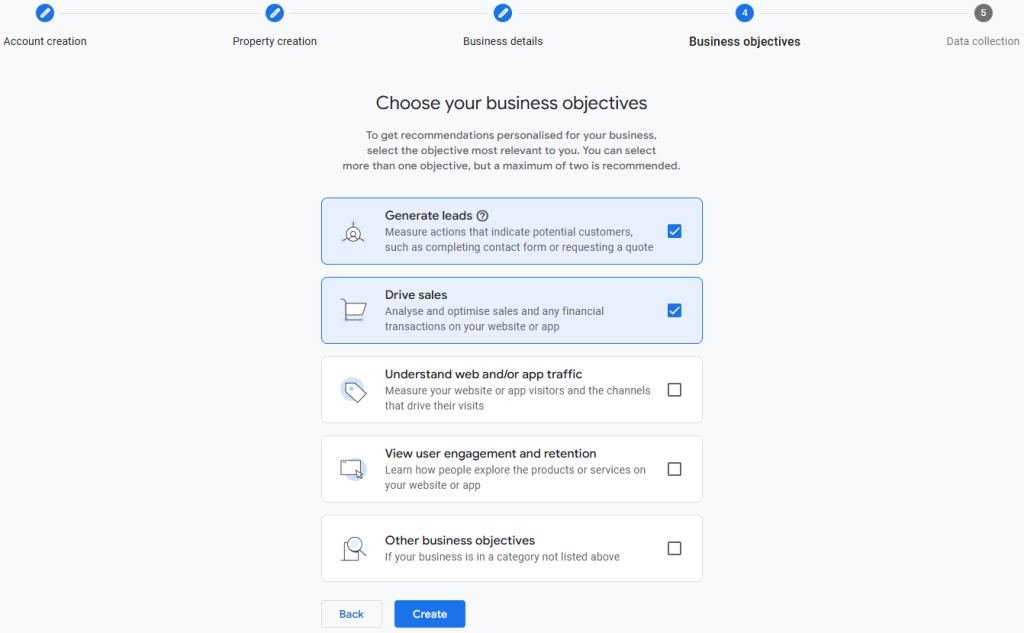
On this step, you need to specify your business objectives. This is important because Google will automatically customise your Google Analytics dashboard based on your selection (you can adjust your dashboard in the Report Library after the fact).
If you’re unsure what options to choose, here is a breakdown:
- Generate Leads: Select this if your website is designed to capture enquiries, sign-ups, or bookings through contact forms or phone calls.
- Drive Sales: Choose this option if you’re selling products (e-commerce).
- Understand web and/or app traffic: This is the option to choose if your main focus is monitoring visitor numbers, traffic sources, and general website or app performance.
- View user engagement and retention: Best for apps or content-heavy sites where you want to see how often users return, how long they stay, and what they interact with.
- Other business objectives: Use this if your goals don’t fit neatly into the above categories, such as building brand awareness or tracking internal portal usage.
You can choose multiple options if you need to.
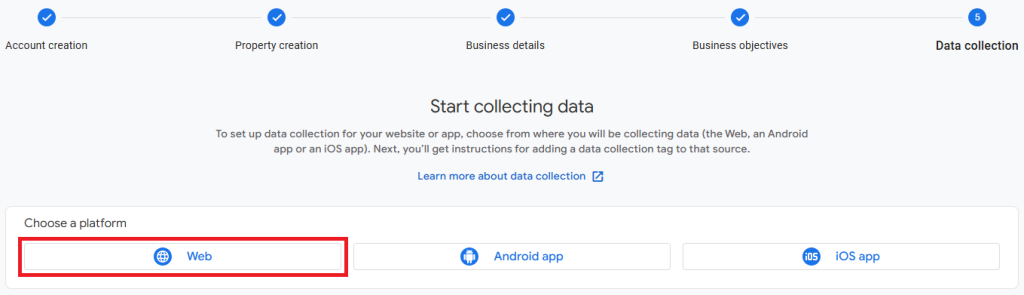
5) Data Collection – Creating a Data Stream
On the final step of the process, you will create a Data Stream for your website.
Begin by selecting “Web” from the options under “Choose Platform”.
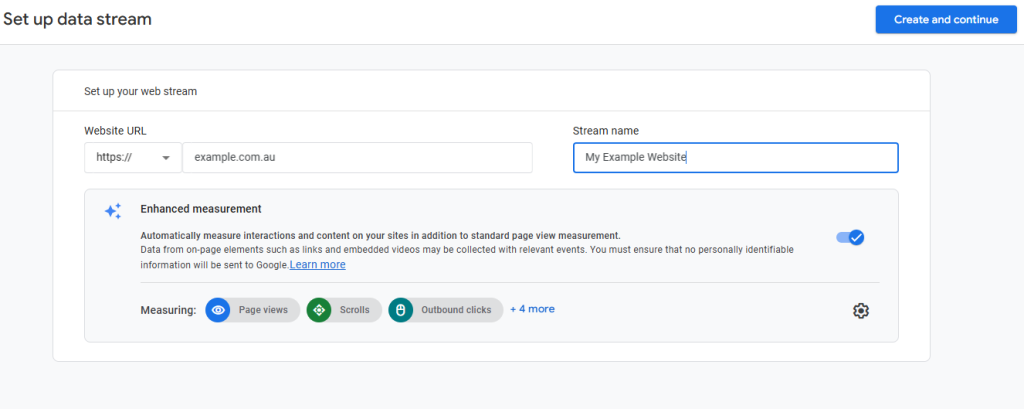
On the next step, input your website’s address and a name for your Data Stream. We recommend turning “Enhanced Measurement” on, as this will enable Google Analytics to automatically collect additional data on users’ interactions with your website.
When you’re ready, click “Create and continue” to proceed to the next step.
In this step, Google Analytics will generate a code snippet for you. This needs to be added to your website so data can be collected. The way you install it will vary depending on the platform your site is built on. Below, we’ll walk you through the installation process for the most common website platforms.
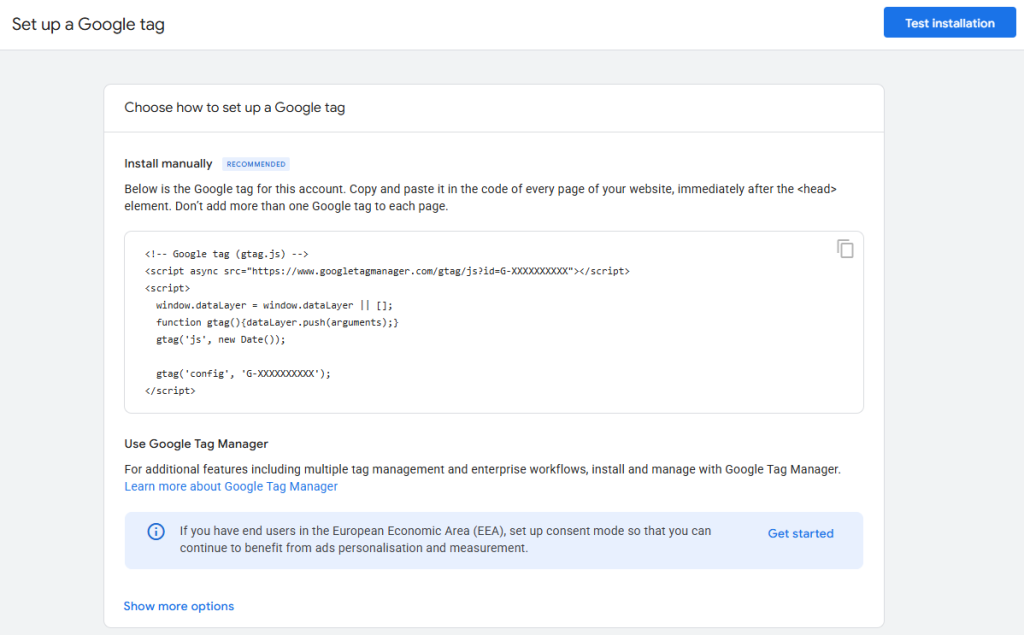
6) Installing the Google Analytics Code snippet
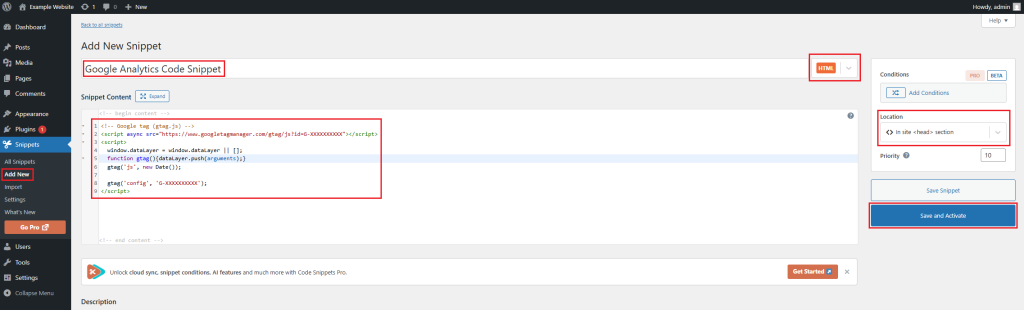
Installing the code snippet in WordPress manually
- Install the Code Snippets plugin for WordPress.
- Click on the “Snippets” in the dashboard menu.
- Click “Add New” to add a new code snippet.
- Paste the snippet into the text box below “Snippet Content”.
- Set the snippet type to “HTML”.
- Set the Location to “In site <head> section”.
- Set a name for your snippet and then click “Save and Activate”.
Installing Google Analytics Code Snippet on other platforms:
- Setting up Google Analytics 4 on Shopify
- Setting up Google Analytics 4 on Wix
- Setting up Google Analytics 4 on Squarespace
- Setting up Google Analytics 4 on Weebly
- Setting up Google Analytics 4 on BigCommerce
- Setting up Google Analytics 4 on Magento (Adobe Commerce)
- Setting up Google Analytics 4 on Drupal
7) Verify that data is flowing
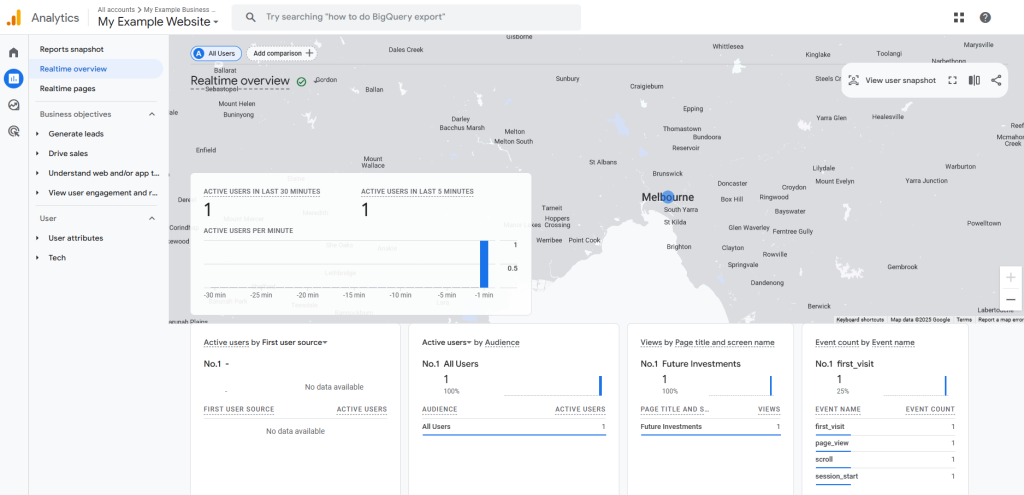
To verify that Google Analytics is working, you can:
- Open your website in a new browser tab.
- In Google Analytics, go to Reports → Realtime Overview to confirm active users are showing as you browse.
- Click around a few pages to confirm page views are appearing.
Tip: If the Realtime report doesn’t show anything, clear your browser cache and disable ad‑blockers.
Additional Steps (Recommended)
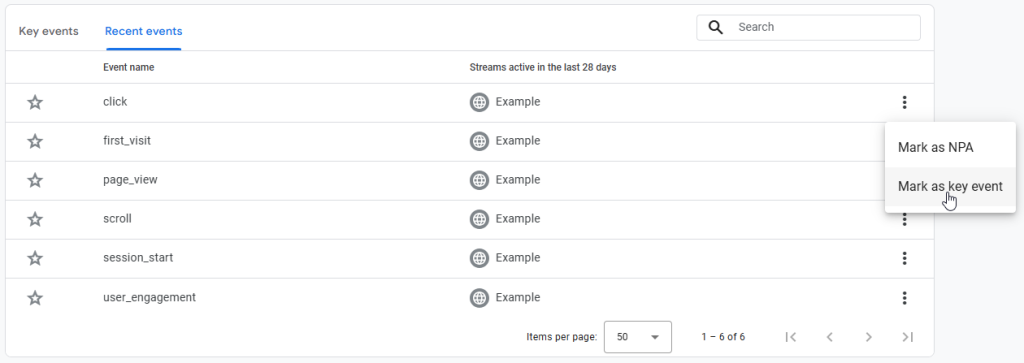
Set up Key Events (Conversions)
One of the most important steps when setting up Google Analytics is telling it what actions matter most on your website. These actions are called Key Events.
Examples of key events include:
- A user completing a purchase.
- Someone is filling in your contact form.
- A visitor signing up for your newsletter.
- A file download or resource access.
Enabling these events is important because it shifts your data from just “how many people visited” to “how many people actually did what I wanted them to do”. This makes it much easier to measure success, track marketing ROI, and optimise your website to get more of the results you care about.
To enable them, go to Admin > Data Display > Events, find the events you want to track, and switch on Mark as conversion.
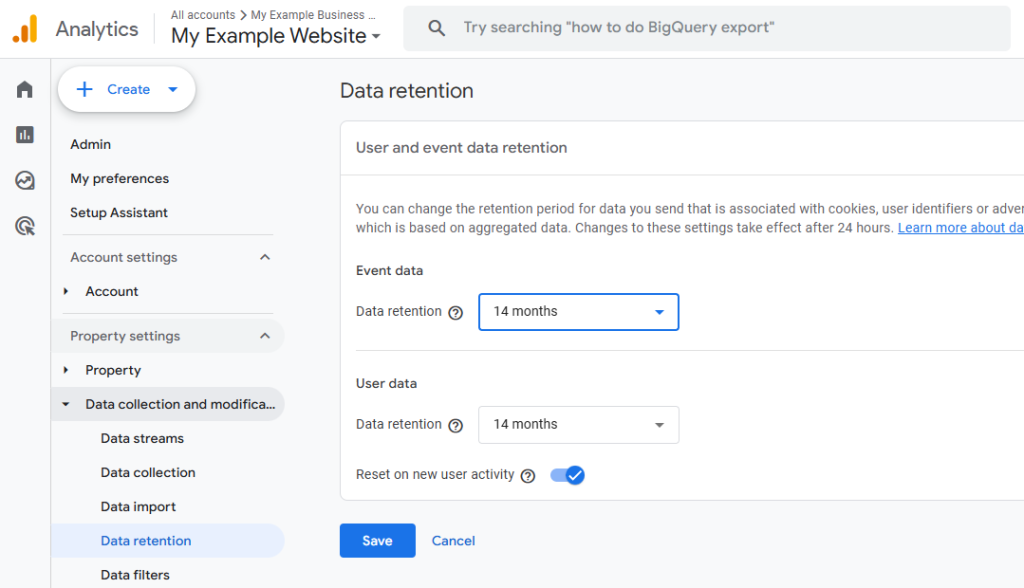
Change Data Retention Settings
By default, Google Analytics only stores Event Data for 2 months. You should set this to the maximum period of 14 months under Admin > Property Settings > Data Collection and Modification > Data Retention.
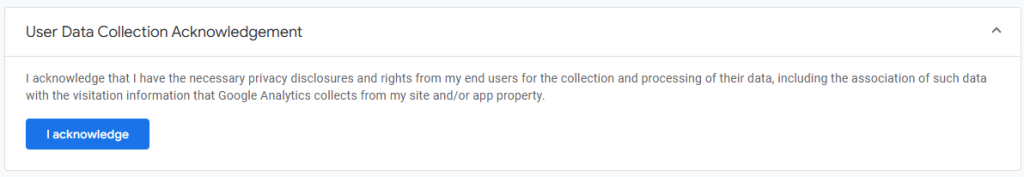
Data Collection Acknowledgement
You should add Privacy Policies and Disclosures to your website explaining that you collect user data. Then complete Google’s User Data Collection Acknowledgement under Admin > Property Settings > Data Collection and Modification > Data Collection.
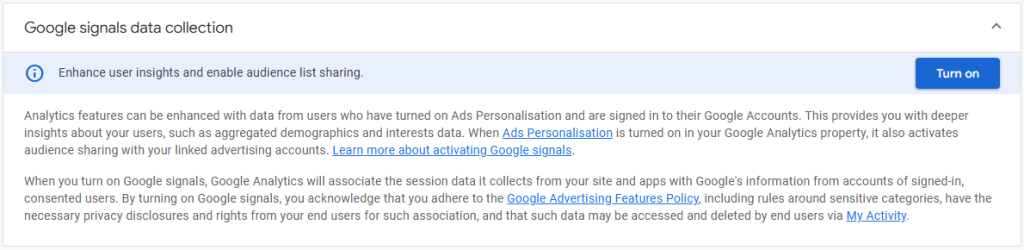
Enable Google Signals
Enabling Google Signals allows Analytics to collect extra anonymised data from people signed in to Google. This unlocks more detailed reports on user location, devices, age groups, gender, and interests. The additional demographic insights give you a clearer picture of who is visiting your website, making it easier to tailor your marketing to the right audience.
To turn it on, go to Admin > Property Settings > Data Collection > Get Started with Google Signals.
Using Google Analytics
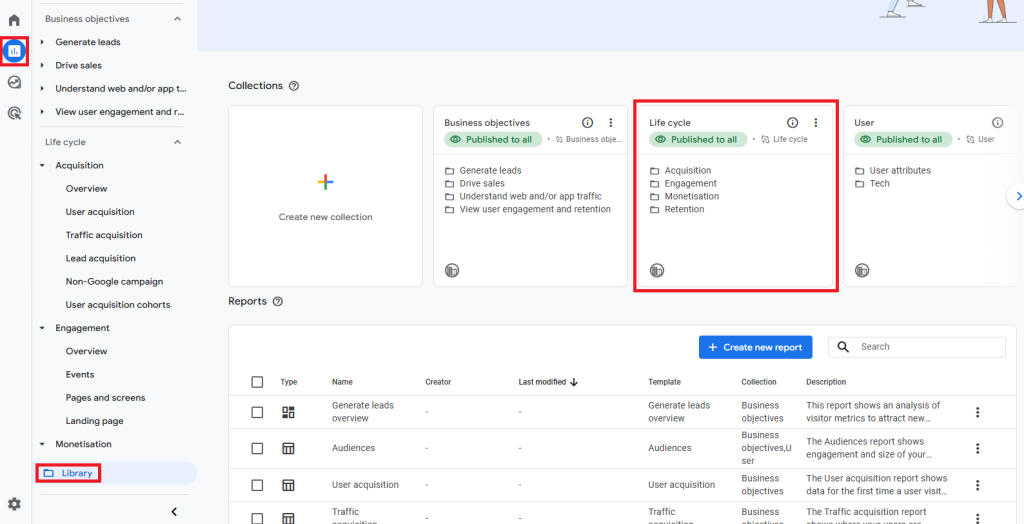
Important Note: Please keep in mind that Google Analytics customises your dashboard based on the options you chose in the Business Objectives step of the setup process. In this section of the article, we’ll reference different reports that may not appear for you out of the box. If you don’t see them, you need to publish the “Life Cycle” Collection in the Reports Library, then they will appear.
Quick Wins with Google Analytics
If you’re just getting started, focus on these three reports first:
- Acquisition → Traffic Acquisition: See where your visitors are coming from (e.g. Google search, social media, ads, referrals).
- Engagement → Pages and Screens: Discover which pages are most popular and how people interact with them.
- Engagement → Events: Track key actions like form submissions, clicks, or purchases.
These three areas alone will show you who’s visiting, what they’re looking at, and whether they’re taking the actions you want.
Understanding User Behaviour in Google Analytics
Once Google Analytics is collecting data, the most valuable insights come from analysing how visitors use your website. Google Analytics includes a range of reports that help you do this:
- Landing pages: Check the Engagement → Pages and Screens report to see which pages users land on most often.
- Engagement metrics: In the Engagement → Overview, you’ll see average engagement time, engaged sessions, and events.
- Demographics and devices: Go to Reports → User → User Attributes → Demographic Details and Reports → Tech → Overview to see visitor details.
Using Google Analytics Data to Improve Your Business
Google Analytics becomes truly valuable when you act on the data. Here are some practical ways to apply it, with report examples:
- Refine your marketing strategy: The Acquisition → Traffic Acquisition report shows which channels bring visitors.
- Optimise content performance: In Engagement → Pages and Screens, identify top-performing and underperforming pages.
- View conversion rates: Review Reports → Engagement → Events or Monetisation → Ecommerce Purchases if you sell online.
Advanced Features in Google Analytics
Once you’re comfortable with the basics, Google Analytics offers more advanced features to give you deeper insights and control:
- Explorations: You can create Explorations in the Explore section of Google Analytics. These allow you to dive deeper into user data and extract more detailed insights.
- Event Customisation: Create custom events (e.g. tracking clicks on a “Book Now” button or video plays) to measure actions that matter most to your business.
- Goal Tracking for Non-Ecommerce Sites: Even if you don’t sell products online, mark enquiries, bookings, or downloads as Key Events (conversions) so you can measure ROI.
- Realtime Monitoring: Reports → Realtime Overview is handy during campaign launches or email sends, letting you confirm traffic is flowing as expected.
- Integrations with other Google Tools: Link Analytics with Google Ads, Search Console, and Looker Studio to create a complete marketing view.
- Attribution Reports: In Advertising → Key Events → Key Event Attribution Paths, see how different channels (e.g. Facebook, Google Search) work together to drive conversions (You must link Google Ads to you Google Analytics account for this section to work).
Real-World Examples: How Small Businesses Use Google Analytics
Real-World Example: A Local Café
Let’s say you run a café with an online menu and booking page.
- In Engagement → Pages and Screens, you notice the Menu page is the most visited. For this reason, you decide to add a prominent “Book a Table” button there.
- In Engagement → Events, you track how many people click the button and decide to mark it as a conversion.
- In Acquisition → Traffic Acquisition, you see that most visitors come from Instagram. You decide to run more promotions there, linking directly to the menu.
- Finally, in Realtime, you check that clicks increase immediately after posting a new Instagram story. So you focus more on posting on Instagram, rather than other platforms.
Result: By making small, data-driven changes, you increase bookings without guessing where to focus your marketing.
Real-World Example: An Online Retailer
You operate an e-commerce store selling clothing and want to boost sales.
- In Monetisation → Ecommerce Purchases, you see that most sales come from repeat visitors. Because of this, you create a remarketing audience that contains people who viewed products but didn’t buy.
- Using Advertising → Key Events → Key Event Attribution Paths, you notice many customers first click a Facebook ad, then return via Google Search to complete their order. This leads to you adjusting your ad budget to give both channels fair weight.
- Within the Monetisation → Checkout Journey report, you spot a high drop-off at the shipping details step. You decide to simplify the form and add free shipping over a threshold, reducing cart abandonment.
Result: Higher conversion rates and more efficient ad spend.
Real-World Example: A Tradie (Plumber)
You’re a local plumber wanting to generate more service enquiries through your website.
- In Engagement → Events, you set up a conversion for clicks on the “Call Now” button.
- In Acquisition → Traffic Acquisition shows most visitors come from Google Search, not Facebook. So you begin to focus on SEO and Google Ads instead of boosting social media posts.
- In Real-time, you monitor spikes in traffic when running Google Ads during peak demand (weekend emergencies).
Result: More calls come directly through the website, and marketing spend is focused on the most effective channels.
Real-World Example: A Business Consultant
You’re a consultant offering strategy sessions who wants to increase bookings.
- In Engagement → Pages and Screens, you notice the blog gets the most views. So you add a booking Call-to-Action button at the end of your most popular articles.
- In Events, you track clicks on “Book a Consultation” and mark them as conversions.
- In User → Demographics, you see that most visitors are aged 35–44 and based in Sydney and Melbourne. So you create tailored LinkedIn Ads targeting that audience.
Result: A steady increase in consultation bookings from the right type of clients.
Next Steps with Google Analytics
Getting Google Analytics set up is just the beginning. To get the most value from your data:
- Check reports regularly: Make a habit of reviewing your Acquisition, Engagement, and Conversion reports weekly.
- Experiment and optimise: Use insights to test new content, improve navigation, and refine your marketing campaigns.
- Set new goals as you grow: As your business changes, update your key events and conversions to match your current objectives.
- Explore advanced features: Over time, you can add Google Tag Manager, create custom audiences, and connect Analytics with tools like Google Ads and Looker Studio.
The more familiar you become with your reports, the easier it will be to see patterns, spot opportunities, and make informed decisions that grow your business.
Remember: Analytics is not a one-time setup. It’s an ongoing process that helps you understand your customers, improve your website, and get more value out of your marketing efforts.
Turning Data Into Decisions
Setting up Google Analytics is one of the most valuable steps you can take as a small business owner. It does more than count visitors. It helps you see where people come from, what they do on your site, and whether they complete the actions that matter most to your business.
Once the basics are in place, you can:
- Track important actions such as purchases, enquiries, or bookings.
- Understand which marketing channels bring in results.
- Find opportunities to improve your website content and navigation.
- Build remarketing audiences to re-engage potential customers.
- Share reports and dashboards with your team for clearer decision-making.
The real strength of Google Analytics is that it turns numbers into insights you can act on. By reviewing your data regularly, you can make better marketing decisions, allocate your budget more effectively, and create a smoother experience for your customers.
Analytics is not something to set up once and then forget. Your website, your audience, and your goals will keep changing. As long as you continue exploring the reports and features, Analytics will guide you in the right direction. Start with the key reports, build confidence over time, and apply what you learn to grow your business online.
Combine these insights with a reliable website, fast hosting, and strong security, and you will have a foundation that supports long-term growth without the guesswork.
Now that you’ve set up Google Analytics, check out our blog post on how you can get more traffic to your website.