


Support Centre
Find the answers to your questions and get the support you need with the VentraIP help centre.
Browse by Popular

Domain Name
- What is a domain name?Eligibility criteria for registering .AU domain namesPremium domain names explained

Web Hosting
View All
Email Hosting
View All
Google Workspace
- Getting Started with Google WorkspaceGoogle Workspace support resourcesTransferring an existing Google Workspace service to VentraIP

Account
- How do I reset my VIPcontrol password?How do I create a VentraIP account?How can I see who accessed my VentraIP account?

Troubleshooting
- How do I clear my browser cache?Troubleshooting a ‘500 internal server' errorTroubleshooting with a ping test
Monitoring CPU, Memory, and I/O resource usage in cPanel
If you would like to check your cPanel account’s resource usage, here are the steps:
- Login to cPanel
- Click on Resource Usage under Metrics
- Click Current Usage
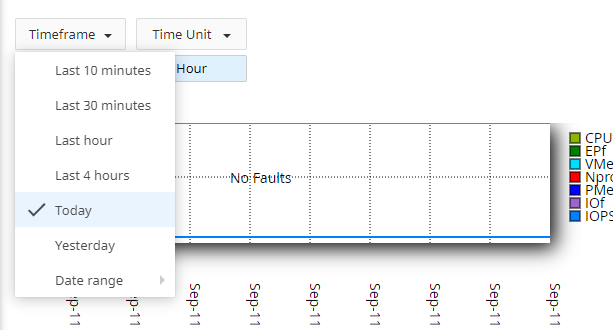
This section of the cPanel interface will show you graphs of your usage, you can adjust the time frame it shows.
If you’re not sure what to do when you find that you’re hitting your limits, we have a separate guide on how to do that.
What is a fault?
Every time your account reaches its CPU, Memory or I/O limit. This is logged as a single “fault”.

We Are Here to Help You
Get in touch with one of our local experts at any time.