
Browse by Popular

Domain Name
- What is a domain name?Eligibility criteria for registering .AU domain namesPremium domain names explained

Web Hosting
View All
Email Hosting
- Outlook 365 (Classic) Email Setup GuideMail app setup for iOS (iPhone + iPad)Gmail (webmail) email setup

Google Workspace
- Getting Started with Google WorkspaceGoogle Workspace support resourcesTransferring an existing Google Workspace service to VentraIP

Account
- How do I reset my VIPcontrol password?How do I create a VentraIP account?How can I see who accessed my VentraIP account?

Troubleshooting
- How do I clear my browser cache?Troubleshooting a ‘500 internal server' errorTroubleshooting with a ping test
Google PageSpeed Insights – Server Response Time
Server Response Time is a metric used by Google to calculate the time it takes to load HTML from our serverless network latency between Google’s testing server and our server. Google considers a server ‘slow’ if the response time is greater than 200ms.
This is often very misleading to web developers and web administrators. When you read ‘Server Response Time’, you think it must be the server being slow and in no way related to the website itself.
Well, it isn’t straightforward. There are many variables involved with Server Response times, server load itself, network routing, your own cPanel account resource consumption, number of database queries being performed etc.
Is the server slow, or is it my page content?
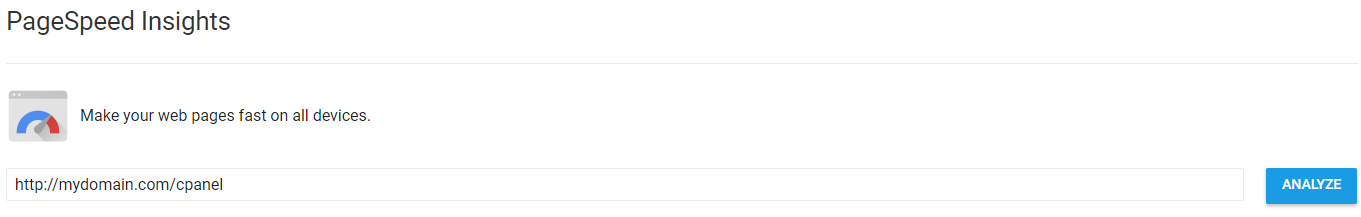
You can run the Page Insights test on the cPanel login page to test the server’s performance for a very simple page: http://mydomain.com/cpanel/.
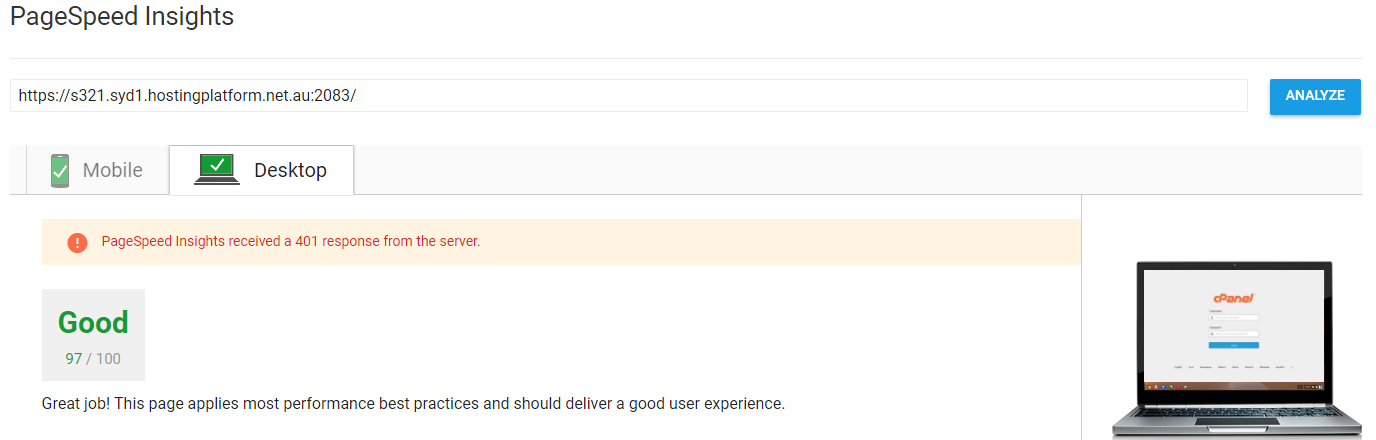
Running this test gives you true insight into the server performance. It completely takes your site, your resources and everything else out of the picture. If this comes back as anything longer than 1 second, you know there is an issue with the server itself. Although we actively work to keep all servers with low load, if you notice this goes on for longer than 15 minutes, please get in touch with the Technical Support team.
If the result comes back, ‘Your server responded quickly’ – You can pretty much rule out the server is running slow’ and that there must be something related to your site that is causing the slowdown.
So, the site is somehow causing the server to respond slowly. Some things to check:
- Check you aren’t hitting your resource limit: cPanel > CPU and Concurrent Connection Usage: From here, you can inspect your account’s performance usage. If you find the account is hitting is being ‘limited’ or constantly running very close to 100% resource consumption, you may need to upgrade your account to more resources.
- Try disabling all your plugins and rerunning the test: Having dozens of plugins all running simultaneously can cause delays in the site performance; try disabling them all and rerunning the test to see if the response time improves or even changes.
- Try loading the site into your browser: It seems strange, but does the actual site load and feel slow? Is it sluggish? The most important test is obviously how the site feels and loads. Visitors to your site aren’t going to notice the difference between a response time of 200ms or 600ms. They will, however, notice if your images are 2MB each and take forever to load.
PageSpeed Insights by Google is a great tool that can point you in the right direction for making your site perform better. But it shouldn’t be used just by itself when determining performance. And certainly, you shouldn’t take one metric to determine that the server is causing the slowness. There are a lot of variables to take into account.
I recommend you try other sites too to measure performance:
- https://www.webpagetest.org/
- https://www.pingdom.com/
- https://gtmetrix.com/
Using a mix of all these can help determine the cause of the slowness and often give you great insight into your site’s performance.
Also, it is fun to run the test on the test itself and notice that even Google’s own servers are ‘responding slowly’: http://developers.google.com.